What outcome-based pricing means in healthcare
Outcome-based pricing is a value-based payment model in which providers earn revenue only when members achieve defined, measurable clinical improvement. It differs from other value-based payment models because it ties a substantial portion of fees directly to outcomes rather than spending benchmarks or quality bonuses.
Sword Summary Warm-up
Don’t have time for the full workout? We’ve got you covered with a quick, high-intensity session. Here are the key takeaways:
- MSK remains one of the hardest categories to forecast because the same condition can produce wildly different cost trajectories, and fee-for-service gives you no mechanism to predict or control which path a member takes.
- Outcome-based pricing changes the financial signal: payment follows defined milestones tied to verified member improvement, giving health plans billing they can forecast and defend.
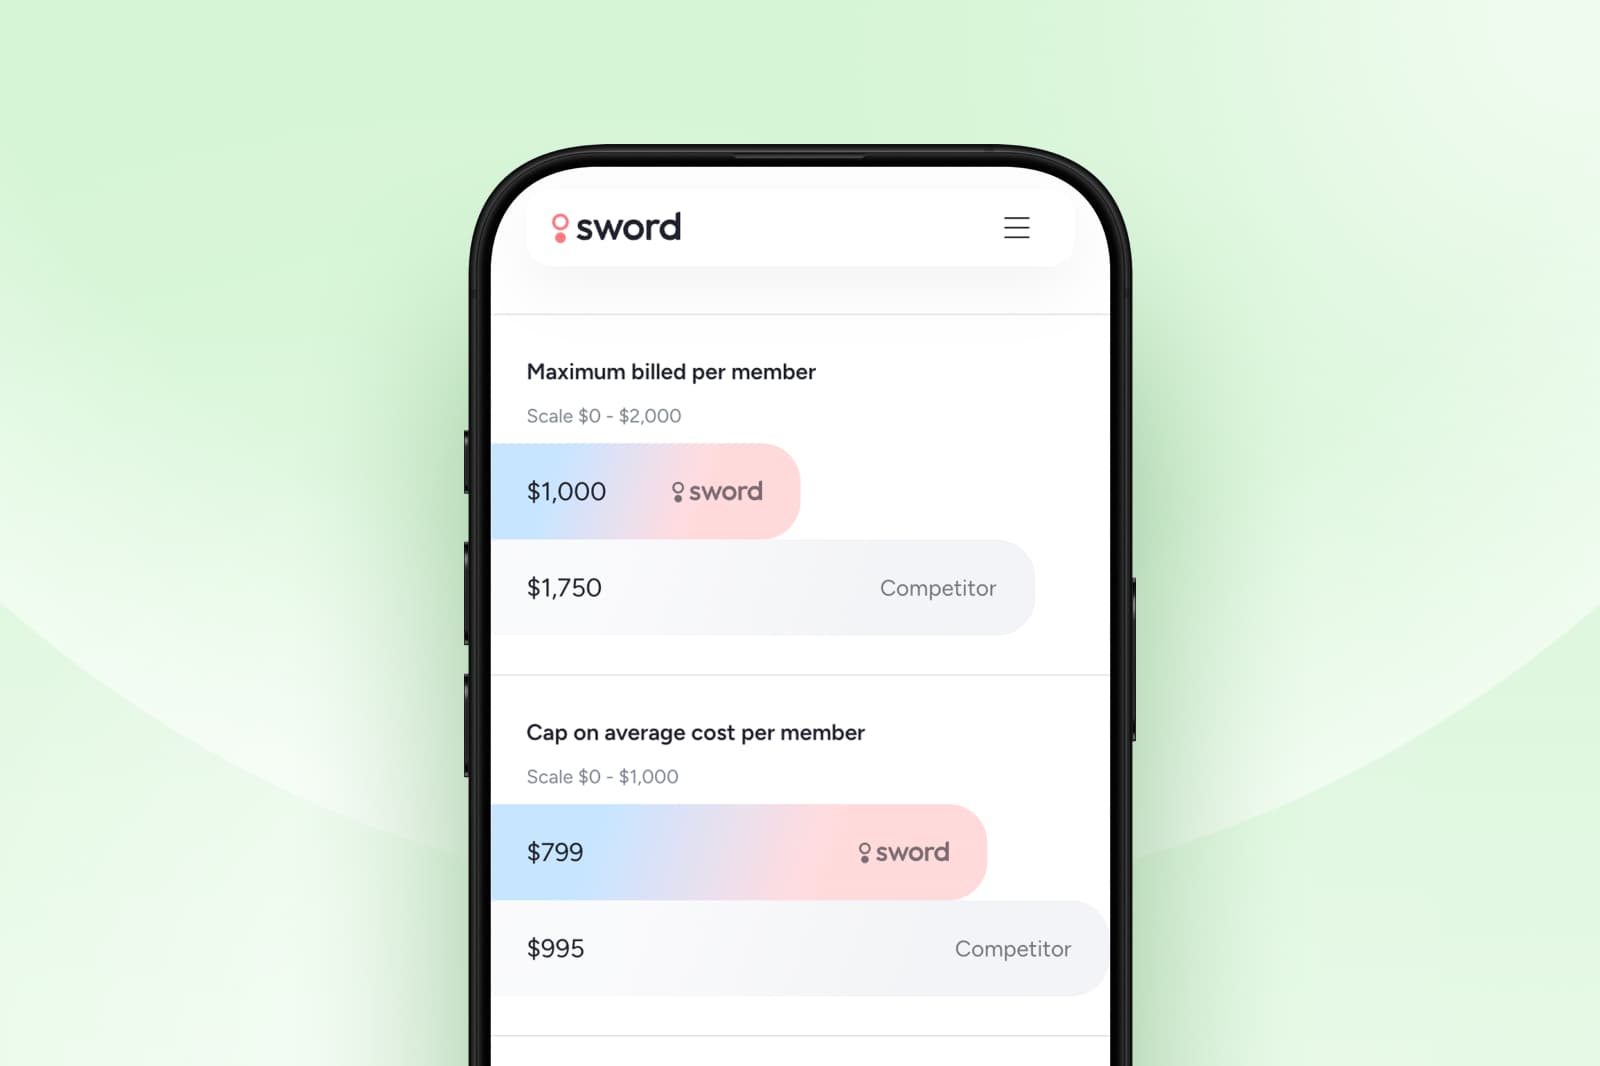
- Sword's Outcome Pricing ties 50% of fees to improvement on the Patient Global Impression of Change (PGIC), making billing transparent and auditable at the member level.
- Independent analysis validates $2,934 per member per year in savings and a 3.7x ROI for fully-insured populations, with comparable figures across ASO and Medicare Advantage segments.
The MSK review that never gets easier
You've sat in this meeting before. MSK costs are up again. The CFO wants to know why. The honest answer is that you can't fully trace it: imaging that came in late, a surgery that moved faster than expected, a few high-cost cases the system didn't catch in time.
You paid for all of it. Whether any of it actually helped those members get better is a question the billing data can't answer.
Most health plan leaders already know the current MSK model isn't working. The cost trend makes that clear every year. What's harder to name is why every attempt to change it seems to stop short: vendor contracts that use outcome language but bill like fee-for-service, reporting that looks transparent until you try to reconcile it to an invoice, savings claims that rely on Sword's own methodology rather than independent review.
That's the core problem. The traditional model pays for activity, not results. Every visit, every scan, every referral generates a charge whether or not the member improved. Outcome-based pricing is a direct response: payment is tied to whether members actually get better, the billing follows clear rules, and the triggers are defined in the contract before care begins.
MSK is the right place to pilot outcome-based pricing
A few conditions make MSK especially suited to this kind of payment model. The waste is real and measurable:
- Rates of common procedures like hip, knee, and shoulder replacement vary widely from one region to the next, even within the same state.8 10
- Many of those procedures don't improve long-term outcomes for the conditions they treat.3
- Clinical guidelines support exercise-based conservative care as the right first step for most MSK conditions, and progress with that approach can be tracked with simple patient feedback rather than expensive diagnostic tests.11 12
- Digital MSK programs also create consistent care pathways and produce reliable outcome data at scale.
These factors make outcome-linked contracts practical to govern, not just appealing in theory. When you can measure improvement clearly, you can build a payment model around it.
What an effective outcome-based pricing contract looks like
At its core, outcome-based pricing is simple: you pay for results, not just services.
A good model has a few non-negotiable features. The definition of success is clear and written into the contract upfront. The improvement threshold is explicit so both sides know exactly when a payment is triggered. Billing follows milestones tied to member recovery, not claim volume and the contract terms that make this enforceable (including audit rights, reporting cadence, and missing-data rules) matter as much as the pricing model label.
When those conditions are met, forecasting improves. You're no longer trying to budget against unpredictable claim patterns. You're working with a model where payment follows rules both parties agreed to before care started.ims to arrive late and budgets to miss. Research consistently shows administrative costs are a large and underappreciated driver of total healthcare spend.1 2 Outcome-based pricing removes much of that friction because billing doesn't follow every service, it follows results.
How Sword's Outcome Pricing works
Sword introduced Outcome Pricing in September 2024. The model is built to be simple enough to explain in a procurement meeting and detailed enough to hold up in a finance review.
Sword structures payment in two milestones.
- The first 50% is billed when a member activates: this covers the purpose-built hardware they use to complete their care plan at home, plus the cost of onboarding and care planning.
- The remaining 50% is billed only when the member gets meaningfully better.
How is "better" defined? Through a simple question members answer during their program: compared to when you started, how are you feeling now? This measure, called PGIC (Patient Global Impression of Change), is widely used in clinical research and recommended by independent regulatory guidance as a reliable way to assess whether someone has actually improved.7 Sword uses a score of 5 or above as the threshold for meaningful improvement, and Sword writes that threshold into the contract.
The outcome is verifiable at the member level. Finance teams can see exactly what triggered each payment and what didn't. Nothing is hidden.
Sword first introduced engagement-based pricing in 2020, when clients paid only when members actively used the program. Outcome Pricing takes that further: now you pay for results, not just participation.
The numbers show the impact of matching payments to results
- For commercial health plans, independent analysis found $2,934 per member per year in medical savings and a 3.7x return on investment.5
- For Medicare Advantage populations, Milliman found $3,770 per member per year and a 4.7x ROI.
- For self-insured employer plans, Risk Strategies Consulting independently validated $3,177 per member per year in gross savings and a 3.24x gross ROI, or $2,197 net of fees for presentations to CFOs and finance teams.5
These aren't Sword's own numbers. They're independently attributed, which is what makes them defensible when the CFO asks where they came from. The savings reflect what happens when payment requires improvement: care moves earlier, conservative treatment replaces high-cost escalation, and members recover instead of accumulating claims.
GUARANTEED SAVINGS
Get the industry's highest ROI and slash MSK spend with Sword
3.2x
Average ROI (the industry's highest independently-validated rate)
70%
reduction in surgery intent
41%
fewer ancillary services
10%
drop in MSK-related MRIs
35%
reduction in spine surgeries
The question the contract has to answer
There is a test worth applying to any MSK vendor that claims to be outcome-based. Ask them to show you, in the actual contract language, what happens when a member doesn't improve. Not in the pitch deck. Not in the case study. In the contract.
Most can't answer that clearly, because the accountability lives in the marketing, not the mechanics. When a vendor can show you the exact clause, the exact threshold, and the exact reporting that reconciles outcomes to invoices, you're looking at genuine accountability.
That's the decision worth making this year. Not whether outcome-based pricing sounds good in principle, but whether the vendor you choose can show you the mechanics before you sign.
Set up a call with a Sword expert to see how outcome-based pricing works in practice for your population, your plan design, and your procurement requirements.
About the author

Sword Editorial Team
Evidence-based healthcare insights