Sword Summary Warm-up
Don’t have time for the full workout? We’ve got you covered with a quick, high-intensity session. Here are the key takeaways:
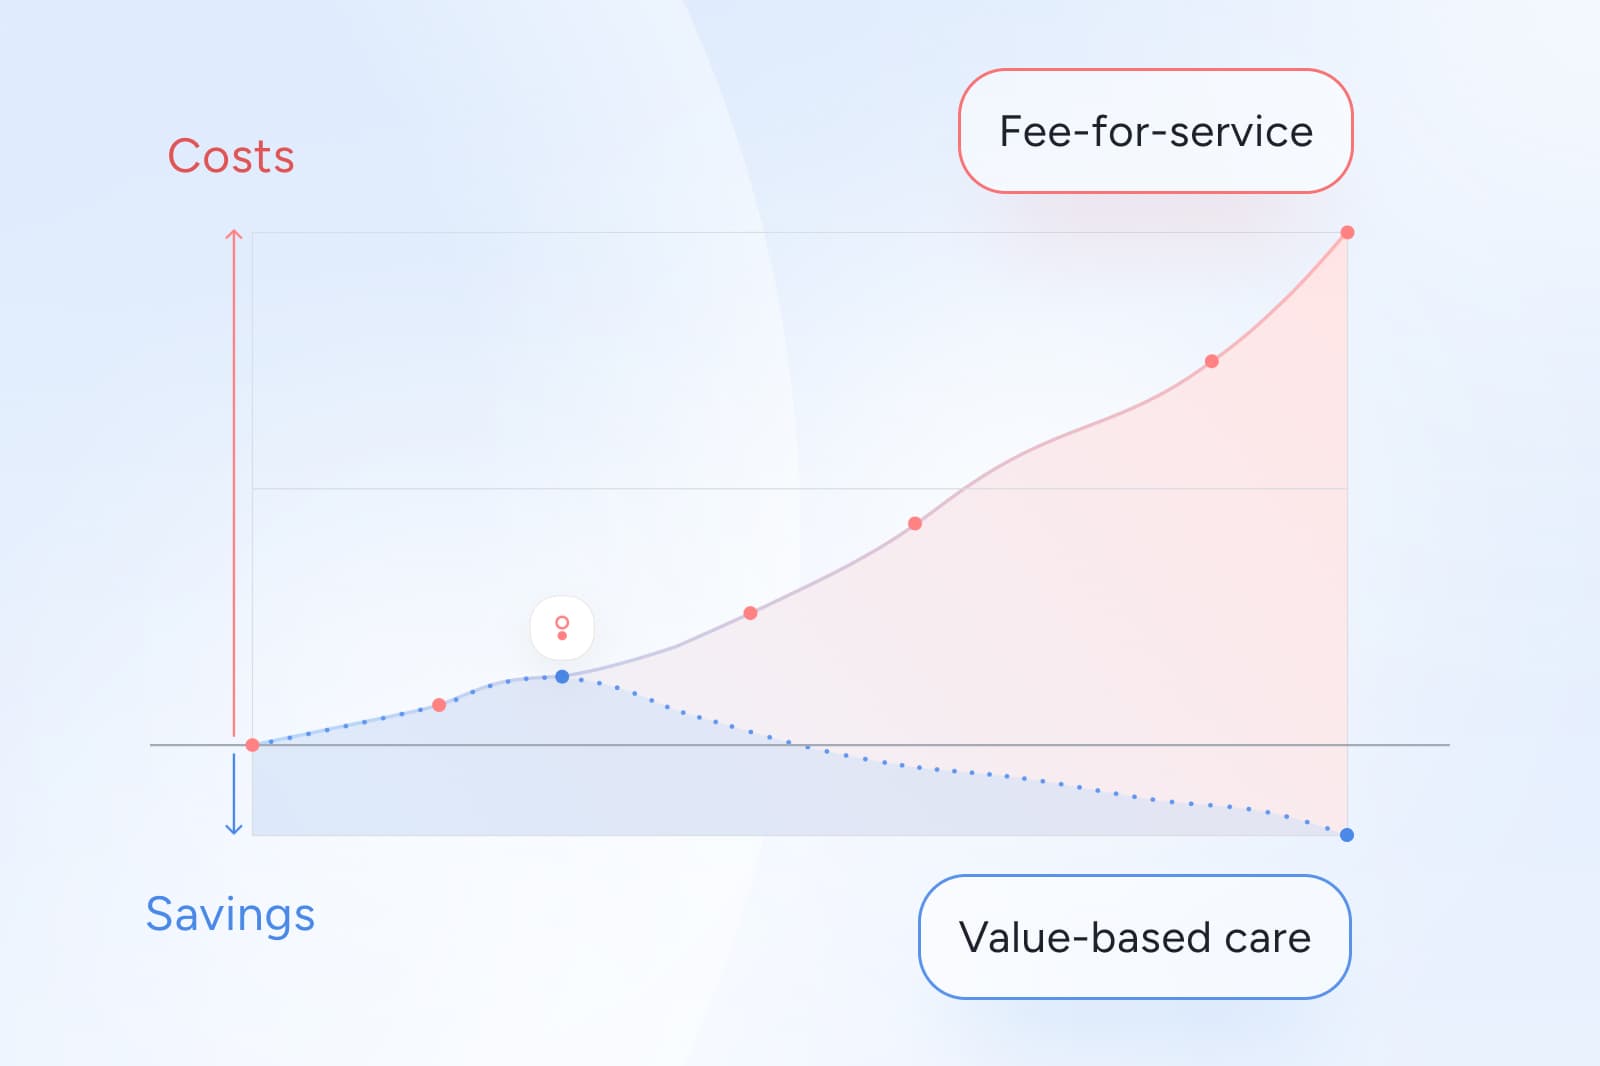
- Fee-for-service keeps MSK costs climbing because payment is tied to volume, not recovery, so low-value imaging and procedures persist even when outcomes do not improve.³ ⁶ ⁸
- Value-based models work when they make outcomes measurable and payment rules auditable, which turns MSK from a volatile claims category into something finance can forecast and governance can defend.¹⁰
- Administrative complexity is part of the fee-for-service problem. More transactions create more friction, denials, and noise, and that noise shows up as forecasting uncertainty.¹ ²
- The practical goal is not to “go value-based” in the abstract. It is to choose MSK partners and contract terms that reward improvement and reduce escalation.⁹
The hidden reason MSK costs keep rising
For many health plan and finance leaders, MSK spend can feel like a force of nature. Claims arrive in fragments, high-cost events show up late, and forecasting requires buffers that never seem to shrink.
A major reason is structural: fee-for-service (FFS) rewards activity. It pays for services whether or not those services meaningfully improve function, pain interference, or quality of life. In MSK, that creates a predictable pattern of rising utilization and ambiguous value, especially when imaging, injections, and procedures are used in ways that do not align with clinical guidelines.³ ⁶ ⁸
Value-based care changes the incentive. Instead of paying for volume, it ties reimbursement to outcomes, quality, or efficiency. Done well, it makes the relationship between spend and improvement clearer, which is exactly what health plans need to manage trend with confidence rather than hope.⁷
If you want a quick map of the main options and how they affect risk and cash flow, check out our guide to value-based payment models.
Why fee-for-service inflates MSK spend for health plans
FFS reimburses each discrete service performed. In MSK, that structure tends to inflate spend in three consistent ways.
1. It rewards activity instead of recovery
Under FFS, each visit, scan, injection, or procedure generates revenue. The model does not require proof that a service improved a member’s function or reduced disability. That makes high-volume care financially rational even when the value is uncertain.³ ⁶
2. It fragments the MSK journey and multiplies claims
MSK episodes often involve multiple handoffs: primary care, imaging, specialist consults, procedural care, and post-procedure rehab. Each step creates additional claims, coding variation, and utilization noise. That fragmentation makes it harder to connect total spend to actual improvement.
3. It has no built-in safeguard against low-value escalation
Unless the plan intervenes through utilization management, early imaging and escalation can happen even when conservative care is the recommended first-line approach. Studies have documented patterns of increasing use of imaging and other interventions in spine-related care that do not consistently align with guideline-based management.³ ⁸
The MSK care cascade that drives late-quarter surprises
Here is how FFS turns a common MSK symptom into an expensive episode.
A member develops back or joint pain. Under a typical FFS pattern:
- A visit leads to imaging before a full course of conservative care
- Imaging findings trigger specialist referrals and additional interventions
- The pathway accelerates toward procedures, even when expected benefit is limited for many patients
- Rehab adds another layer of services and claims
In spine-related care, national trend data has shown increases in imaging and other higher-intensity services over time.³ And in MSK more broadly, evidence reviews show that some commonly used procedures in degenerative conditions provide limited benefit for many patients, reinforcing why “more care” is not the same as “better care.”⁴
For health plans, the financial signature is all-too-familiar:
- higher and more variable costs
- late-arriving high-cost claims
- fragmented data that obscures what drove the spend
- ongoing difficulty explaining whether members actually improved
FFS does not intentionally create waste but the financial incentives for the healthcare provider don't always match the most efficient path to recovery.
Fee-for-service also tends to adds administrative noise
FFS is not only a clinical utilization issue. It is also a transaction engine. More billed services mean more documentation, coding variation, denials, appeals, and resubmissions.
Administrative costs are widely cited as a large share of US healthcare spending, often described as roughly a quarter of total spend.¹ ² For health plans, this complexity shows up as operational friction and forecasting uncertainty, because claims timing and adjudication can become less predictable when volume rises.
The takeaway for finance and plan leaders is practical: when the payment model creates more transactions, it also creates more volatility.
Fee-for-service vs value-based care: what changes for MSK
Fee-for-service
- pays for services provided
- rewards higher volume
- produces fragmented claims and noisy utilization patterns
- makes it hard to verify whether spend produced improvement
Value-based care
- ties payment to outcomes, quality, or efficiency
- creates incentives for earlier, conservative pathways
- reduces the business case for low-value escalation
- strengthens predictability because performance and payment rules are clearer
Across the market, alternative payment models and value-linked payments have been expanding, supported by multi-payer measurement efforts that track adoption across payers and provider settings.¹⁰
MSK is an ideal pilot to transition to value-based care
MSK is a strong proving ground for value-based transformation because:
- Variation is high across providers and markets, which creates avoidable cost differences.⁹
- Low-value care is common enough to materially affect plan trend.³ ⁸
- Conservative, guideline-aligned care can be effective and measurable.⁵
- Outcomes like function and pain interference can be tracked with validated tools, which enables accountable contracting.⁷
This combination is rare in healthcare. It is why MSK is often where buyers can see the earliest wins from shifting incentives.

How value-based care corrects fee-for-service flaws
When MSK care shifts into value-based models, the core improvements are incentive-driven:
- Better pathways become easier to scale because programs are designed around measurable progress
- Low-value escalation is easier to prevent because contracts can reward recovery, not volume
- Reporting becomes a governance tool, not just a retrospective story
- Forecasting improves because payment and performance rules are more legible
The important nuance is that not every contract labeled “value-based” delivers these benefits. The contract has to make accountability real.
How to identify MSK partners aligned with value-based care
When you evaluate MSK partners, the most revealing questions are the ones that connect outcomes to payment and reporting. Use the following questions as your checklist to assess different vendors:
- Does the model reduce unnecessary imaging and avoidable procedures, or does it simply manage them after the fact?³ ⁸
- Are outcomes measured with validated tools, with clear thresholds and time windows?⁷
- Is payment tied meaningfully to improvement rather than visits or utilization?
- Does the partner simplify operational complexity, or add reporting without accountability?¹ ²
- Is there independent validation of savings methodology, or only vendor-reported claims?
If a partner cannot answer these clearly, the plan is unlikely to escape fee-for-service dynamics.
How Sword’s outcome pricing simplifies healthcare success
Outcome-linked contracts go one step further by making payment rules explicit. Sword Health pioneered Outcome Pricing as a contract structure that ties payment to measurable healthcare improvements. This makes billing triggers clear, predictable, and transparent.⁹
- Payment triggers are tied to predefined outcome thresholds
- Reporting supports auditability and verification
- Pricing is structured to be predictable and transparent for teams evaluating ROI and trend impact ⁹ ¹⁰
GUARANTEED SAVINGS
Get the industry's highest ROI and slash MSK spend with Sword
3.2x
Average ROI (the industry's highest independently-validated rate)
70%
reduction in surgery intent
41%
fewer ancillary services
10%
drop in MSK-related MRIs
35%
reduction in spine surgeries
Under Outcome Pricing, clients do not pay in full unless members achieve predefined, clinically meaningful improvement, supported by transparent triggers and auditable reporting.¹¹ When you pair that structure with independently validated methodology, it becomes easier to defend MSK purchasing decisions to finance partners and governance stakeholders.¹²
Set up a chat with a Sword expert to see what outcome pricing would look like for your population, plan design, and procurement requirements.¹⁰
About the author

Sword Editorial Team
Evidence-based healthcare insights